

I remember almost wasting an hour trying to figure out how to have to Y-Axis
The key is to combine two graphs with the same X variable and two different Y variables.
In my case, I had to plot asset size and some other financial measure.
For the code, let’s use the auto.dta
sysuse auto
**Collapse the data (get mean for cleaner graphs)
collapse (mean) price mpg, by(weight)
**key syntax in bold
twoway line price weight, yaxis(2) || line mpg weight, yaxis(1)
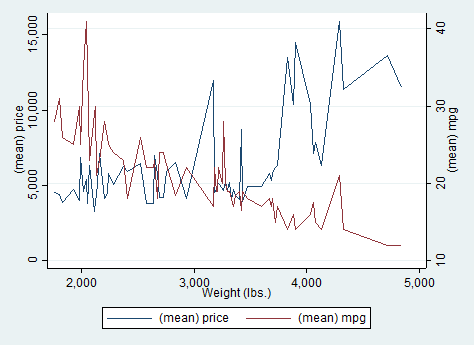
Yay! Two Y-Axis!
Please like the post if it was helpful and if it helped you save time! If you have more questions, please do comment and we will learn together
Happy coding ^^
